LASS 專案 - Simulator
LASS Simulator
Current code: https://github.com/LinkItONEDevGroup/LASS/tree/master/LASS-Simulator
開發步驟
- 系統基礎帶起
- CLI start
- Log start
- CFG start
- simulation installation check
- unit test start
- start car, Deposition, status with simulation
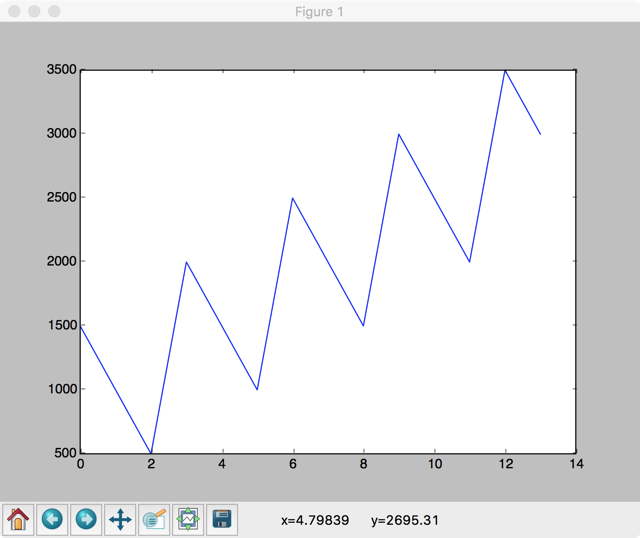
- plot total value
- export ESRI for single and animation
- 支援初始化地理位置設定
- limited wind effect
- load pm2.5 data from LASS
- site filter by lat,lon. load 2 day history
- output sensor value to ASC format of recent 2 days in specific area
- 常數參數化
- map initial value load by LASS sensor data average which locate in the map
需求
- 希望能有效模擬 PM2.5 感測現象,進而提供一些實驗設計參考
規格
- 模擬功能
- 能模擬因人口,車輛的影響
- 能模擬特定燃燒,工廠排放的影響
- 能模擬境內與境外之間的移動特性,比方說境外污染影響
- 能區分高空與低空污染
- 能模擬下雨,沈積,風,颱風的效應
- 能模擬特定氣候效應
- 能模擬特定區域現象
- 模擬區域特性如地理特性能有標準介面以提供匯入定義
- 模擬結果能與目前實際感測值做比較
- 能做小時,天,週,月的模擬
- 資料分析
- 接軌風速風向資料
- 分析模組針對資料做觀察
- 工廠資訊匯入
- 匯入資料的格式,儘量對原始資料不更動
- 匯入檔名由設定定義
- 匯入以下格式
- 機動車輛登記數及密度
- 土地面積、人口及密度
- 環保署列管污染源
- 自動氣象站-氣象觀測資料
- 匯出以下格式
- 現實結合
- 匯入目前 LASS 感測值
- 感測值修正模擬值的歷史記錄
- 模擬與感測值比對分析功能
- 預測
- 預測基礎:溫度,濕度,風向,風速,時間,其他污染物
- 系統功能
- 開源,分享
- 主設計使用 Python
- 使用者參數集中管理與設定
- 核心使用 Command line interface
- 方便客製化設計
- 支援結果繪出 ESRI ASCII Raster format, 能支援動態模擬
設計
基本
- 時間單位:分鐘
- 空間單位:1m 平方,1m 立方
- Cfg : 設定參數,包含各個 Producer 的常態特性,動態特性參數
- 有邊界
Producer
- Village : 一般性的,內含人車以及基本產生量
- Population : 人口
- Car : 車輛
- Factory :
- Combustion : 特定燃燒
Consumer
- Climate : 下雨,颱風等
- Deposition : 沈積
Effect
Boundry
Status
- Map : 整張地圖
- Position : 固定長寬的空間,用 X@Y 來 index
- pm_total : pm 總量
- pm_value : pm 量測值 ug/m3
- Area : 一堆 Position 的組合
設定
基本演算法
- 持續 monitor status
- Producers 給予特定的產生條件,持續產生
- Consumer 持續減少數值
- Apply effects
total ↔ value
- 固定空間大小來當除數
- 配上高度比例,分成生活段(可量測)與高空段(未量測)
跨邊界效應
- 邊界以 value 標示,total 無限
- 污染離開邊界,會更新邊界 value 值
- 污染由邊界傳入,需計算 value * 時間為傳入量
- 邊界值可以依模擬條件,隨時更新,或由模擬條件漸進更新
模擬結果評估
- 模擬結果需要與真實量測結果做比較,藉由在模擬過程中,隨時比較結果,產生差異指標,可能可以作為評估模擬結果有效性的一種方法
- 歷史資料模擬與歷史資料比對,可以用來修正模擬模型的設計。未來的模擬,可以當作預測,預測結果跟後來的真實資料比對,也可以修正預測模擬的設計
- 評估方法 A:預測結果(地圖)與真實結果(感測值地圖),針對感測節點的感測值,數值相減取絕對值,然後做平均,取得這份地圖的評估結果,把所有時段的評估結果取平均,可以得到這份模擬的評估結果
匯入資料
- 機動車輛登記數及密度
- 土地面積、人口及密度
- 自動氣象站-氣象觀測資料
- 環保署列管污染源
- 選用環保署資料CSV格式,與相同的檔案配置,由於資料下載時可能會多次下載組合。需支援整個目錄(含其中的子目錄),邏輯上是將所有相同的檔名合併成一個,在一同匯入。支援以下資料
- 基本資料,裁處資料,廢棄物申報,水污染申報,溫室氣體申報,空氣污染申報,有害空氣污染申報,毒性化學物質申報
及時 Download 新版環境資料
- 針對方便下載及更新頻繁的資料,提供即時下載更新,避免手動更新的麻煩
Files/Directories Definition
doc
- README.txt : release note
Codes : codes
Include :
Output
- ESRI export naming rule:
- output/name_timestamp.asc (ex: abc_20160708210000.asc)
- output/name.xml
- sim.log : system log
Lib : the code that may easy to be reused
test:
sim.py : startup program
Auto environment data update list
| name |
url |
file location(ini variable name) |
帶起步驟設計
Basic fundation, classes/cfg/reporting
車輛與沈積效應的平衡
Wind effect + boundry handler
大地圖, grouping → 走向全台灣模擬
Climate effect
Real data input, real data comparsion
模擬概念圖
目前空汙模式主要在中尺度(a) 模擬的解析度
LASS 觀測為(c) 小尺度觀測成果
當點位資料夠多後可以擴展為(b)區域尺度成果

參考資料來源 http://library.wmo.int/pmb_ged/wmo_8-2012_en.pdf
Versions
V0.0.1
- Basic application fundation, CFG, logging, CLI, unit test, simulation
- Quick support Deposition, Car, Population
V0.1
- Export ESRI
- Some setting from file
- Quick wind effect
V0.2
- quick load sensor data from LASS
- output sensor data by ASC, CSV format
- map corner support and device filter
- 2 day LASS true-data simulation and output for animation
V0.2.1
- simulation history evaluation method.
V0.2.2
- imported population, car density
- imported fixed pollution src
V0.2.3
- imported Taiwan CWB weather station current measurement data
- imported Taiwan CWB GFS current data
資料匯入狀態
| 項目 |
狀態 |
資料週期 |
說明 |
| 土地面積、人口及密度 |
已匯入 |
每季 |
資料內容只有人口,codepage: big5 |
| 機動車輛登記數及密度 |
已匯入 |
每季 |
|
| 環保署列管污染源 |
已匯入 |
每月 |
codepage: utf16 |
| 自動氣象站-氣象觀測資料 |
已匯入 |
即時 |
|
Installation
- We use python 3
- pip3 install simpy
- pip3 install configobj
- pip3 install matplotlib
- pip3 install numpy
- #install QGIS ( QDSL included, QGIS web )
- pip3 install simplejson
- pip3 install vincenty
- #pip3 install wget
- installation pygrib
- not successful to use pip3 to install
- pip3 install pygrib=> either pyproj or basemap required,
- fatal error: ’grib_api.h’ file not found
- pip3 install basemap => No matching distribution found for basemap
- pip3 install pyproj
- for mac
- port install grib_api
- setup pygrib by follow this instruction
- modify setup.cfg,
- setup grib_api_dir
- setup grib_api_libname = grib_api
- download pre-build grib_api binary build for mac
- copy share/grib_api to /usr/local/share
- check by run python test.py
- Install basemap
- http://matplotlib.org/basemap/users/installing.html
- install GEOS - Geometry Engine, Open Source
- port install geos
- port install py35-gdal #may not necessary
- pip3 install pygdal #may not necessary
- use basemap1.0.7
- python setup.py install
- check installation
- from mpl_toolkits.basemap import Basemap : OK
執行
Export CSV Format
timestamp,device_Id, SiteName, gps_lon , gps_lat, PM2_5, PM10, temperature, humidity
timestamp format: yyyy-MM-dd HH:mm:ss
# "timestamp": "2016-10-25T00:00:00Z",
# "temperature": 31.61,
# "humidity": 81.14,
# "PM2_5": 7.62,
# "PM10": 9.15
Study
- Plot Data Points on a Map
- How to make a movie from a ascii grid files?
- gdal tutorial
- ASCII to Raster
Current Progress
- wuulong$ python3 sim.py
- FastCLI> help
- Documented commands (type help <topic>):
- ========================================
- about help quit save_esri save_esri_xml set show simrun test
- FastCLI> help about
- About this software
- FastCLI> about
- G.Fast Monitor version: v0.1
- FastCLI> help save_esri
- Save map to RSRI ASCII format
- save_esri [ name ]
- ; name: export file name prefix
- ex: save_esri map
- ESRI export naming rule:
- name_timestamp.asc (ex: abc_20160708210000.asc)
-
- FastCLI> help save_esri_xml
- Save map to RSRI ASCII xml format
- save_esri_xml [ name ]
- ; name: export file name prefix
- ex: save_esri_xml sim
- ESRI export naming rule:
- name.xml
-
- FastCLI> help set
- set scli variable, can be new or update.
- set var_name var_value
- ex: set mac_addr 001122334455
- FastCLI> help show
- show simcli variables, if miss variable name, show all
- show variable_name
- system variables list:
- ;log level definition, DEBUG=10,INFO=20,WARNING=30,ERROR=40,CRITICAL=50
- log_level_console=20 #the console message log level
- log_level_file=40 #file message log level
- ;device console real time display
- dev_console_display=1 #(0) don’t display (1) display
- ex: show mac_addr
- FastCLI> help simrun
- Start simulation
- FastCLI> help test
- current debug command
- FastCLI>
- root : INFO G.Fast Monitor version: v0.0.1
- FastCLI> simrun
- root : INFO Simulation start!
- Simulation Descriptor:
- 1* deposition -10 every time unit.
- 1* windset setup wind every 10 time unit.
- 1* wind process every time unit.
- 5* population +1 every time unit.
- 1* factory +10 at (5,5).
- root : INFO Map Descriptor:
- Current positions count = 100
- 0.000000 0.000000 0.000000 0.000000 0.000000 0.000000 0.000000 0.000000 0.000000 0.000000
- 0.000000 0.000000 0.000000 0.000000 0.000000 0.000000 0.000000 0.000000 0.000000 0.000000
- 0.000000 0.000000 0.000000 0.000000 0.000000 0.000000 0.000000 0.000000 0.000000 0.000000
- 0.000000 0.000000 0.000000 0.000000 0.000000 0.000000 0.000000 0.000000 0.000000 0.000000
- 0.000000 0.000000 0.000000 0.000000 0.000000 0.000000 0.000000 0.000000 0.000000 0.000000
- 0.000000 0.000000 0.000000 0.000000 0.000000 0.000000 0.000000 0.000000 0.000000 0.000000
- 0.000000 0.000000 0.000000 0.000000 0.000000 0.000000 0.000000 0.000000 0.000000 0.000000
- 0.000000 0.000000 0.000000 0.000000 0.000000 0.000000 0.000000 0.000000 0.000000 0.000000
- 0.000000 0.000000 0.000000 0.000000 0.000000 0.000000 0.000000 0.000000 0.000000 0.000000
- 0.000000 0.000000 0.000000 0.000000 0.000000 0.000000 0.000000 0.000000 0.000000 0.000000
- 2016-10-21 16:00:00
- 2016-10-21 16:01:00
- 2016-10-21 16:02:00
- 2016-10-21 16:03:00
- 2016-10-21 16:04:00
- 2016-10-21 16:05:00
- 2016-10-21 16:06:00
- 2016-10-21 16:07:00
- 2016-10-21 16:08:00
- 2016-10-21 16:09:00
- 2016-10-21 16:10:00
- 2016-10-21 16:11:00
- 2016-10-21 16:12:00
- 2016-10-21 16:13:00
- root : INFO Map Descriptor:
- Current positions count = 100
- 200.764102 359.642367 467.530781 525.391415 549.639635 557.550659 559.550197 559.937512 559.993745 559.999596
- 200.764102 359.642367 467.530781 525.391415 549.639635 557.550659 559.550197 559.937512 559.993745 559.999596
- 200.764102 359.642367 467.530781 525.391415 549.639635 557.550659 559.550197 559.937512 559.993745 559.999596
- 200.764102 359.642367 467.530781 525.391415 549.639635 557.550659 559.550197 559.937512 559.993745 559.999596
- 200.764102 359.642367 467.530781 525.391415 549.639635 557.550659 559.550197 559.937512 559.993745 559.999596
- 200.764102 359.642367 467.530781 525.391415 549.639635 1035.560427 960.594151 835.912018 710.898803 624.919409
- 200.764102 359.642367 467.530781 525.391415 549.639635 557.550659 559.550197 559.937512 559.993745 559.999596
- 200.764102 359.642367 467.530781 525.391415 549.639635 557.550659 559.550197 559.937512 559.993745 559.999596
- 200.764102 359.642367 467.530781 525.391415 549.639635 557.550659 559.550197 559.937512 559.993745 559.999596
- 200.764102 359.642367 467.530781 525.391415 549.639635 557.550659 559.550197 559.937512 559.993745 559.999596
- pm_total history: [4120.0, 8160.000000000001, 12120.0, 15999.999999999996, 19799.999999999996, 23519.96799999999, 27159.808, 30719.34079999997, 34198.300160000006, 37596.34201599997, 40913.062664191944, 44148.02169651198, 47300.76613795842, 50370.85319979004]
- FastCLI>
- Documented commands (type help <topic>):
- ========================================
- about help quit save_esri save_esri_xml set show simrun test
- FastCLI> save_esri_xml test
-
2D Raster Display Sample by QGIS
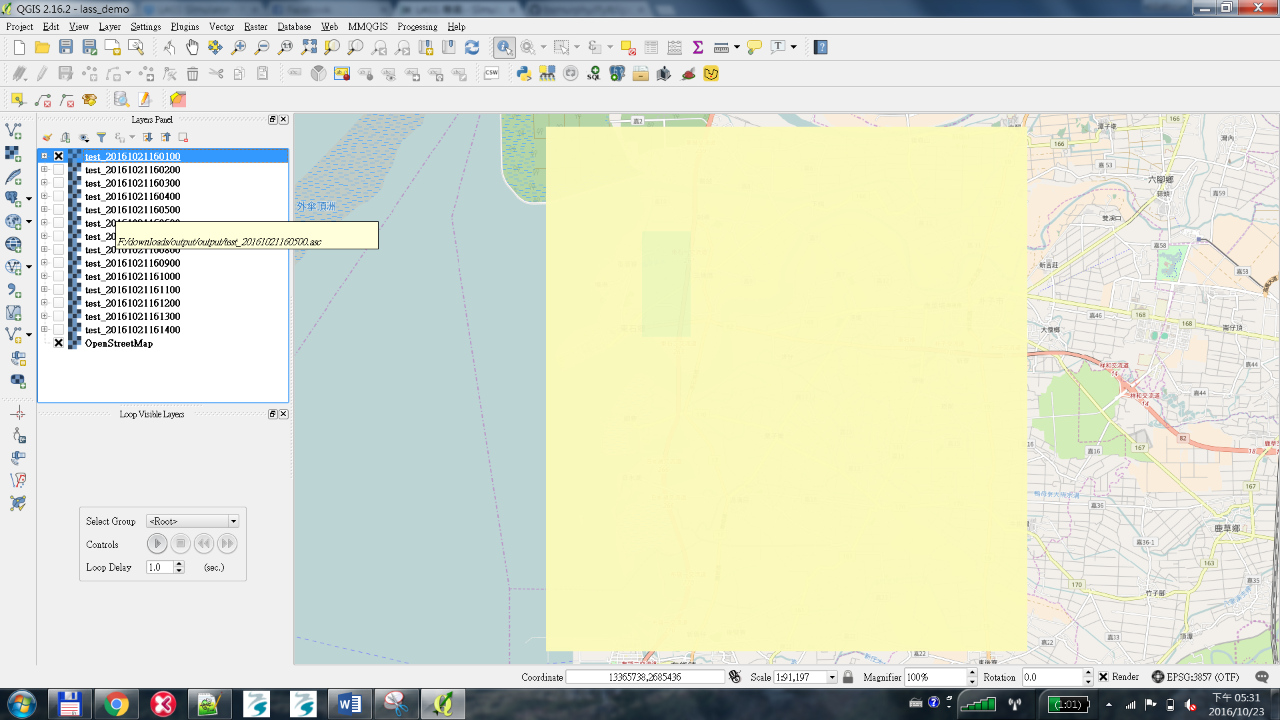
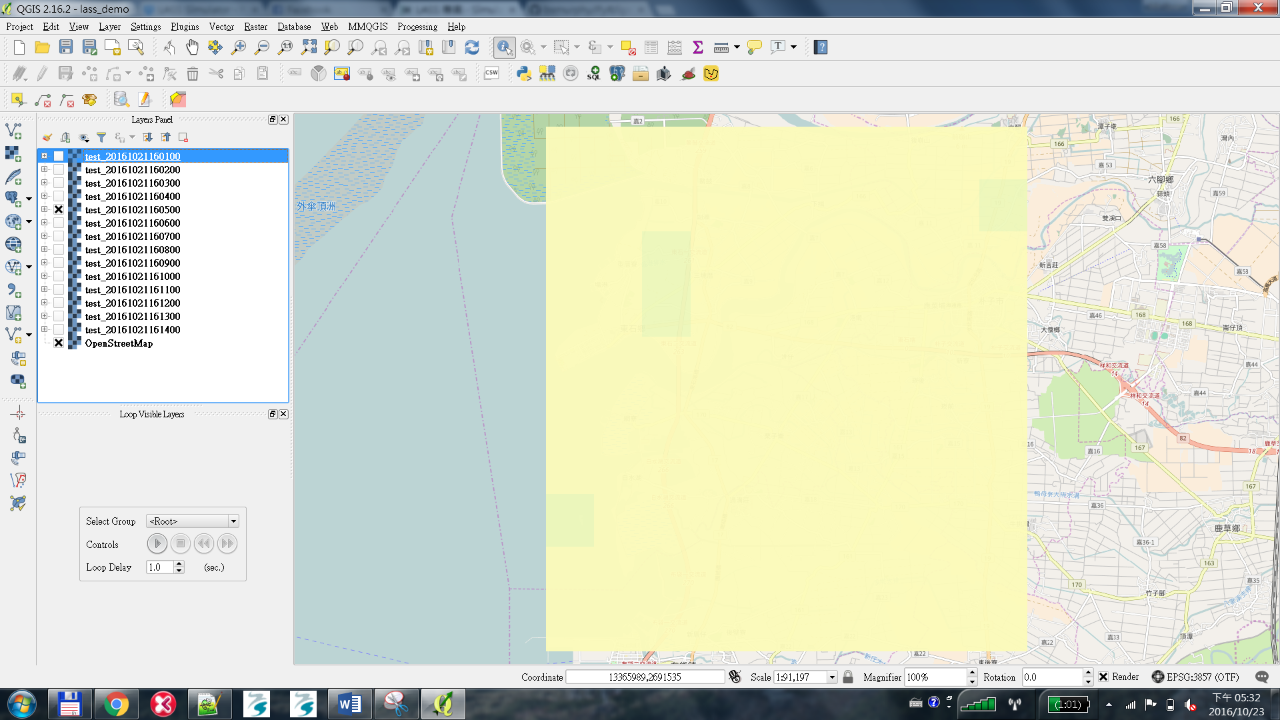
動態展示方式(內插參數還需修正)
https://youtu.be/mGEg9AtpmAo
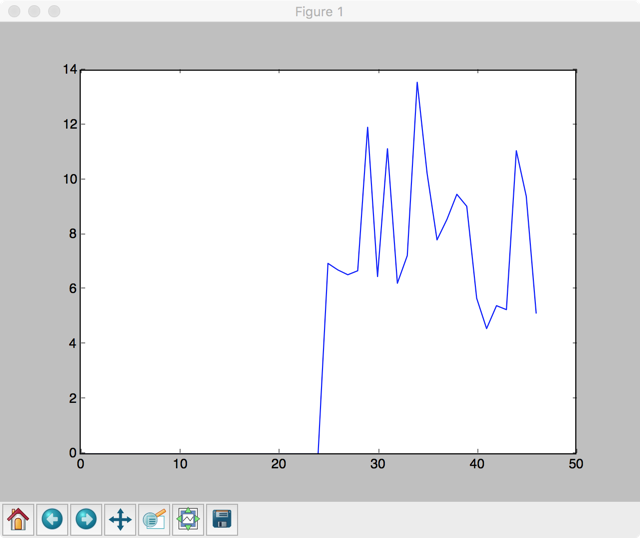
模擬評估
簡單實驗,什麼都不做,用上個小時的值來預測下一個小時,公式是:平均(新小時感測值 - 上一小時感測值)
- root : INFO pm_map_diff history: [0.0, 0.0, 0.0, 0.0, 0.0, 0.0, 0.0, 0.0, 0.0, 0.0, 0.0, 0.0, 0.0, 0.0, 0.0, 0.0, 0.0, 0.0, 0.0, 0.0, 0.0, 0.0, 0.0, 0.0, 0.0, 6.95068493150685, 6.710000000000002, 6.534520547945205, 6.680136986301369, 11.916301369863014, 6.469315068493151, 11.132739726027397, 6.225205479452053, 7.2341095890411, 13.558904109589038, 10.229041095890416, 7.807808219178082, 8.55438356164384, 9.471917808219175, 9.032602739726023, 5.676712328767127, 4.569589041095891, 5.406301369863014, 5.261369863013699, 11.060410958904107, 9.401643835616438, 5.138219178082192]
- root : INFO pm_map_diff average: 7.609649
Problems
3D 問題
基礎參數收集
- 要讓模擬能稍微接近現實,需要收集滿多相關的參數,這個部分嘗試儘量收集一些資訊,歡迎夥伴補充
資料格式
show the hourly average of a partucylar PM25 device in the past two days: http://nrl.iis.sinica.edu.tw/LASS/history-hourly.php?device_id=FT1_001
{
"device_id": "FT1_001",
"feeds": [
{
"timestamp": "2016-10-25T00:00:00Z",
"temperature": 31.61,
"humidity": 81.14,
"PM2_5": 7.62,
"PM10": 9.15
},
...
]
}
參考資料
- 工具
- SimPy
- GNOME
- GNOME (General NOAA Operational Modeling Environment) is the modeling tool the Office of Response and Restoration’s (OR&R) Emergency Response Division uses to predict the possible route, or trajectory, a pollutant might follow in or on a body of water, such as in an oil spill.
- 演算法
- Inverse Distance Weighted (IDW) Interpolation with Python
- Pykrige
- 經緯度坐標轉換與距離計算
- 距離
- 結果例子
- python vincenty
- Difference in destination location between pyproj and geopy
- 坐標轉換
- Global Forecast System (GFS)
- 相關文件
- Complete Study of Factors Contributing to Air Pollution
- 相關的 Open Data
- 機動車輛密度
- 焚化爐煙囪
- 環保署列管污染源查詢系統
- 列管源氣體
- 固定污染源資料
- 之前台中夥伴提供的固定污染源資料
- http://nrl.iis.sinica.edu.tw/EmissionMap/
- 原始GPS點位資料在 http://nrl.iis.sinica.edu.tw/EmissionMap/data.csv
- 臺電水火力發電廠
- MODIS和VIIRS的資料
- 風速與風向
- 自動氣象站-氣象觀測資料
- 全球預報模式-第000小時
- Python interface for reading and writing GRIB data
- GRIB
- GRIB API
- http://nbviewer.jupyter.org/gist/jswhit/8635665
- FM 92 GRIB specification
- Viewer
- GribView
- zyGrib - GRIB File Viewer
- GRIB2 Meta Data and grib_api Keys for Section 3: Grid Definition Section
- GRIB2 Meta Data and grib_api Keys
- CWB 風場
- TWD97 轉 WGS84
- WMO 世界氣象觀測組織 氣象儀器和觀測方法指南
- http://library.wmo.int/pmb_ged/wmo_8-2012_en.pdf